
Modelización Econométrica de Vectores Autorregresivos VAR(p) en RStudio
Estimación de sistemas dinámicos multivariantes VAR(p), pruebas de raíz unitaria y estacionariedad (Dickey-Fuller Aumentado), causalidad en el sentido de Granger, funciones de impulso-respuesta (IRF) y descomposición de varianza.
Econometría de Sistemas Multivariantes: Vectores Autorregresivos (Sims, 1980)
En macroeconomía y finanzas, las variables evolucionan de forma mutuamente endógena. Los modelos de Vectores Autorregresivos VAR(p) tratan cada variable del sistema como función de sus propios rezagos y de los rezagos de las demás variables, permitiendo cuantificar causalidad de Granger y funciones de impulso-respuesta (IRF).
## Loading required package: lubridate##
## Attaching package: 'lubridate'## The following objects are masked from 'package:base':
##
## date, intersect, setdiff, union## Loading required package: PerformanceAnalytics## Loading required package: xts## Loading required package: zoo##
## Attaching package: 'zoo'## The following objects are masked from 'package:base':
##
## as.Date, as.Date.numeric##
## Attaching package: 'PerformanceAnalytics'## The following object is masked from 'package:graphics':
##
## legend## Loading required package: quantmod## Loading required package: TTR## Registered S3 method overwritten by 'quantmod':
## method from
## as.zoo.data.frame zoo## Version 0.4-0 included new data defaults. See ?getSymbols.## == Need to Learn tidyquant? ==================================
## Business Science offers a 1-hour course - Learning Lab #9: Performance Analysis & Portfolio Optimization with tidyquant!
## </> Learn more at: https://university.business-science.io/p/learning-labs-pro </>## -- Attaching packages --------------------- tidyverse 1.3.0 --## v ggplot2 3.3.2 v purrr 0.3.4
## v tibble 3.0.1 v dplyr 1.0.0
## v tidyr 1.1.0 v stringr 1.4.0
## v readr 1.3.1 v forcats 0.5.0## -- Conflicts ------------------------ tidyverse_conflicts() --
## x lubridate::as.difftime() masks base::as.difftime()
## x lubridate::date() masks base::date()
## x dplyr::filter() masks stats::filter()
## x dplyr::first() masks xts::first()
## x lubridate::intersect() masks base::intersect()
## x dplyr::lag() masks stats::lag()
## x dplyr::last() masks xts::last()
## x lubridate::setdiff() masks base::setdiff()
## x lubridate::union() masks base::union()##
## Attaching package: 'plotly'## The following object is masked from 'package:ggplot2':
##
## last_plot## The following object is masked from 'package:stats':
##
## filter## The following object is masked from 'package:graphics':
##
## layout# Load basket prices
tickers <- c("MSFT","JNJ","MA", "PEP", "WMT","MCD")
basket_prices <- tq_get(tickers, get='stock.prices', from='2005-01-01', to = '2020-09-30') %>%
rename(ticker = symbol)
basket_prices %>%
ggplot(aes(x = date, y = adjusted)) +
geom_line(aes(color = ticker))
Por:
Jesús Benjamín Zerpa
Economista
JesusZerpaEconomia@Gmail.Com
Publicado: Noviembre de 2020
 Excepto donde se indique lo contrario, el contenido de esta obra está bajo una licencia de Creative Commons Reconocimiento 4.0 Internacional.
Síntesis: Aplicaciones de los Modelos VAR en Planificación y Finanzas
1. Cuantificación de Efectos de Traspaso (Pass-Through): Las funciones de impulso-respuesta (IRF) y la descomposición de varianza del error de predicción (FEVD) permiten medir el impacto dinámico de choques monetarios, cambiarios o de precios sobre las variables clave del negocio.
2. Rigor Diagnóstico: La verificación de estabilidad de raíces dentro del círculo unitario y ausencia de autocorrelación serial residual garantiza pronósticos multivariantes consistentes.
Otros Trabajos del Portafolio
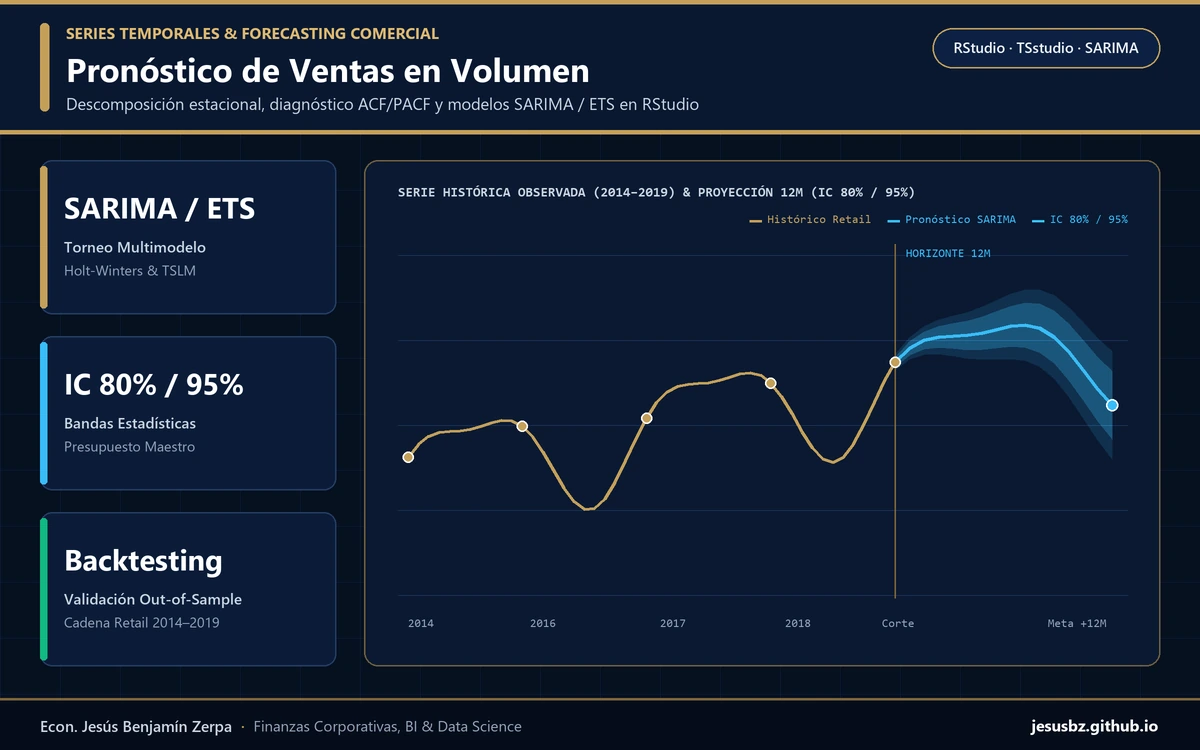 TRABAJO #1
Series Temporales
Modelo de Pronósticos para Ventas en Volumen
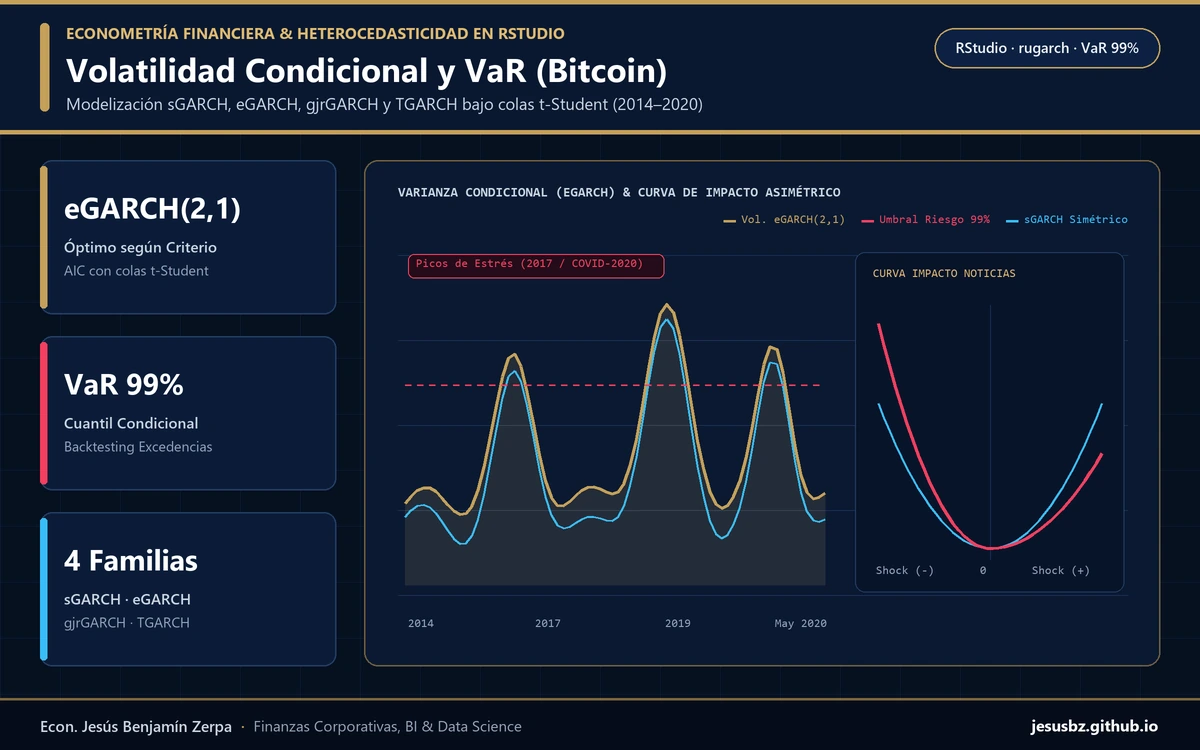 TRABAJO #2
Volatilidad & VaR
Modelización de la volatilidad y Valor en Riesgo (VaR) del Bitcoin
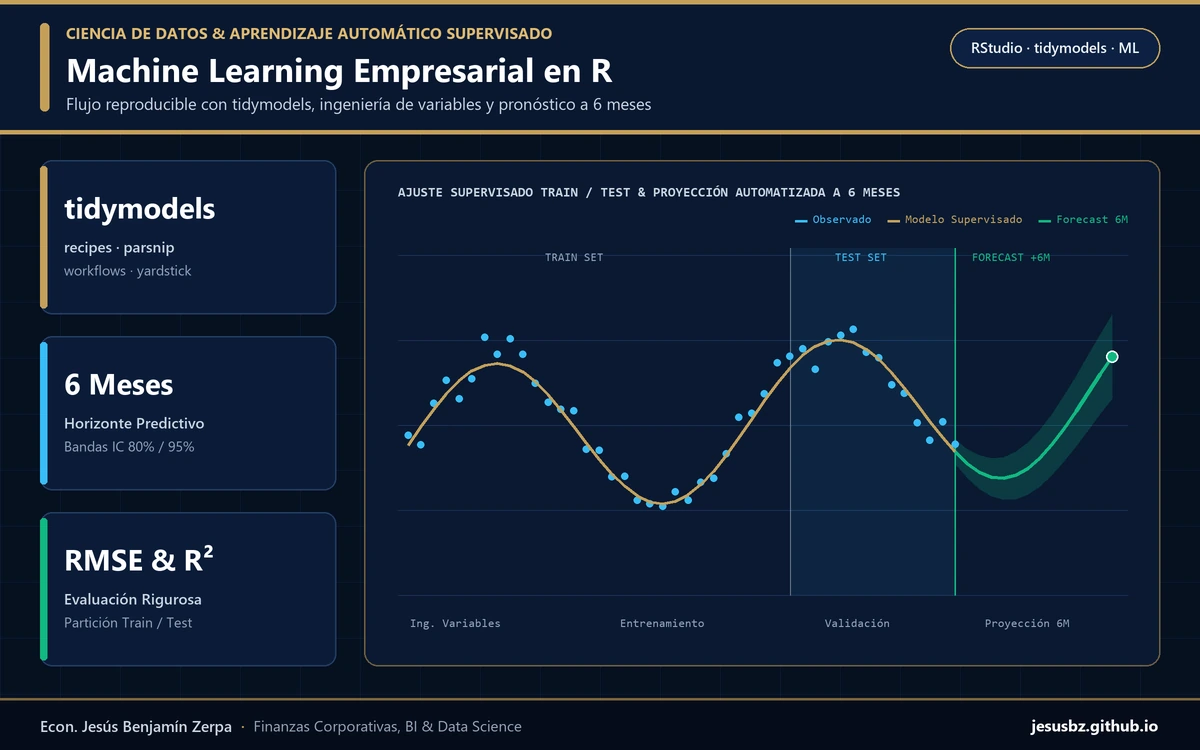 TRABAJO #3
Machine Learning
Aprendizaje Automático (Machine Learning)
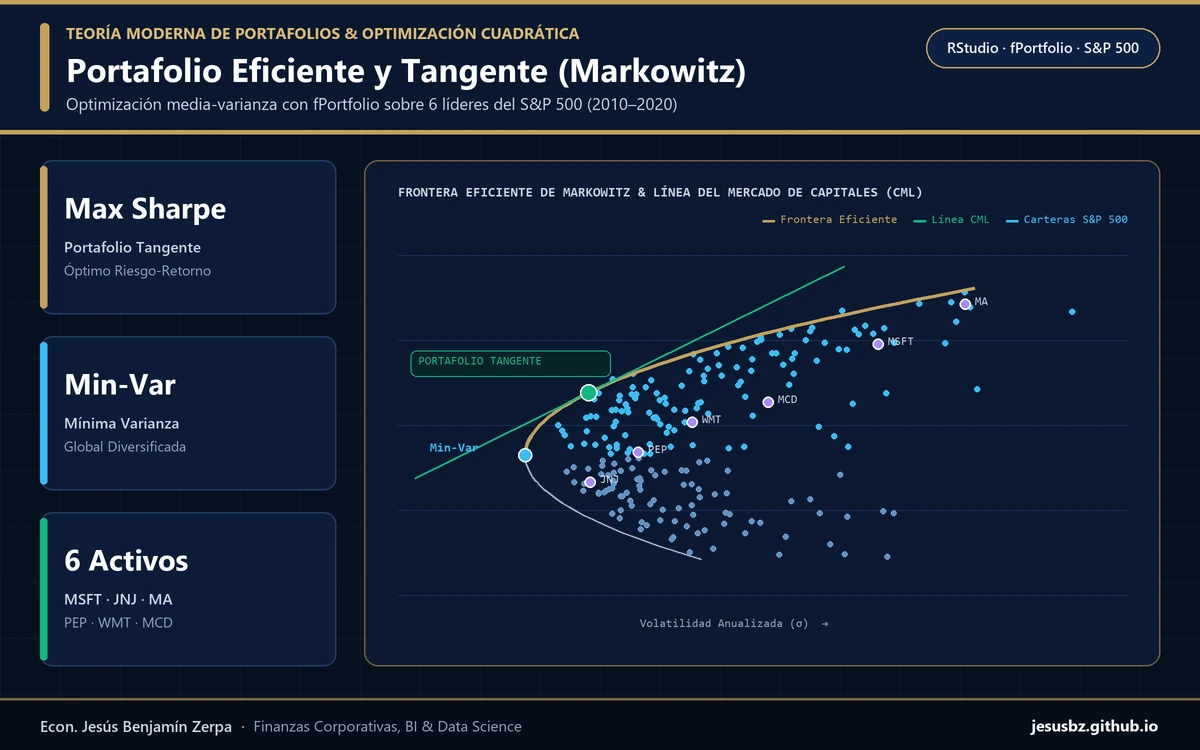 TRABAJO #4
Teoría de Portafolios
Portafolio de Fronteras Eficientes Markowitz
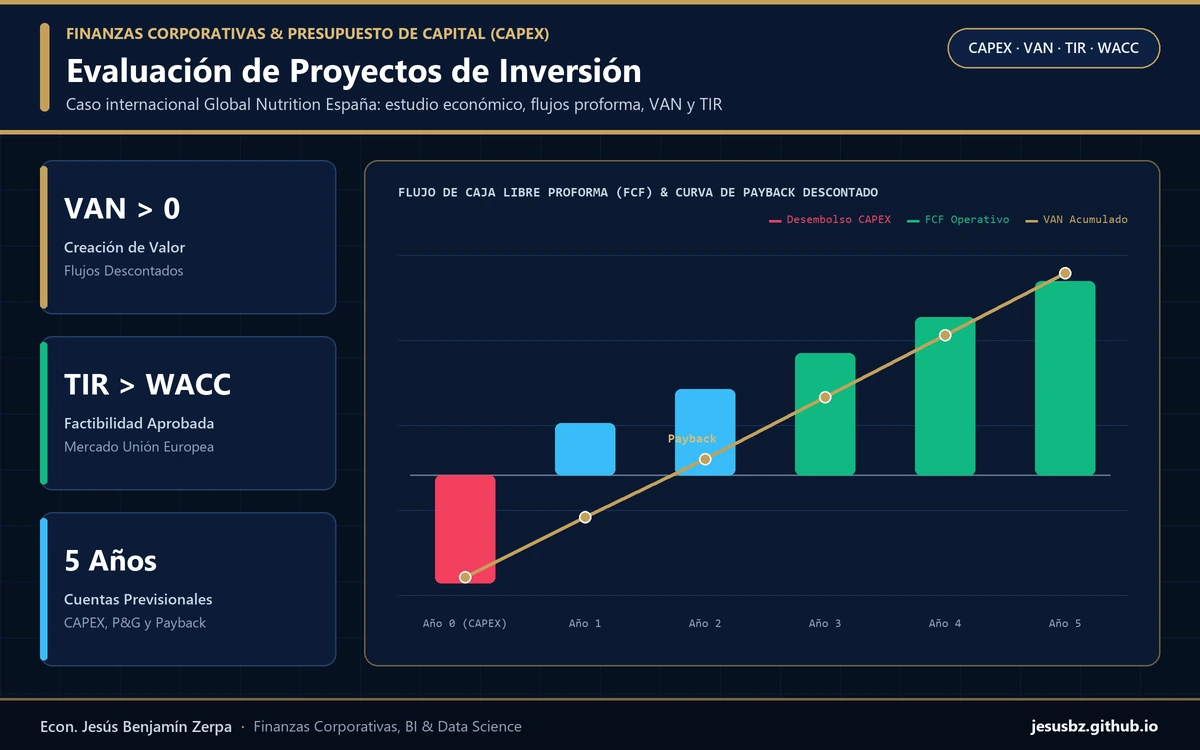 TRABAJO #5
Evaluación de Proyectos
Evaluación y Formulación de Proyectos de Inversión
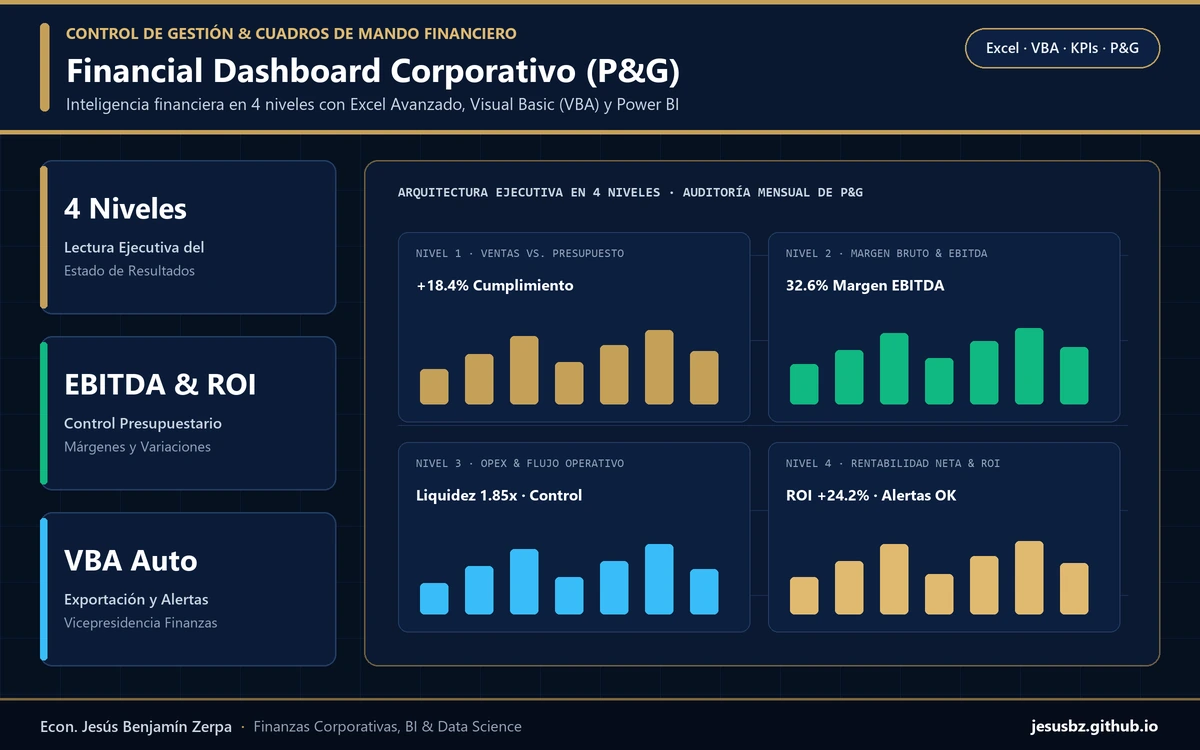 TRABAJO #6
Dashboard Financiero
Financial Dashboard
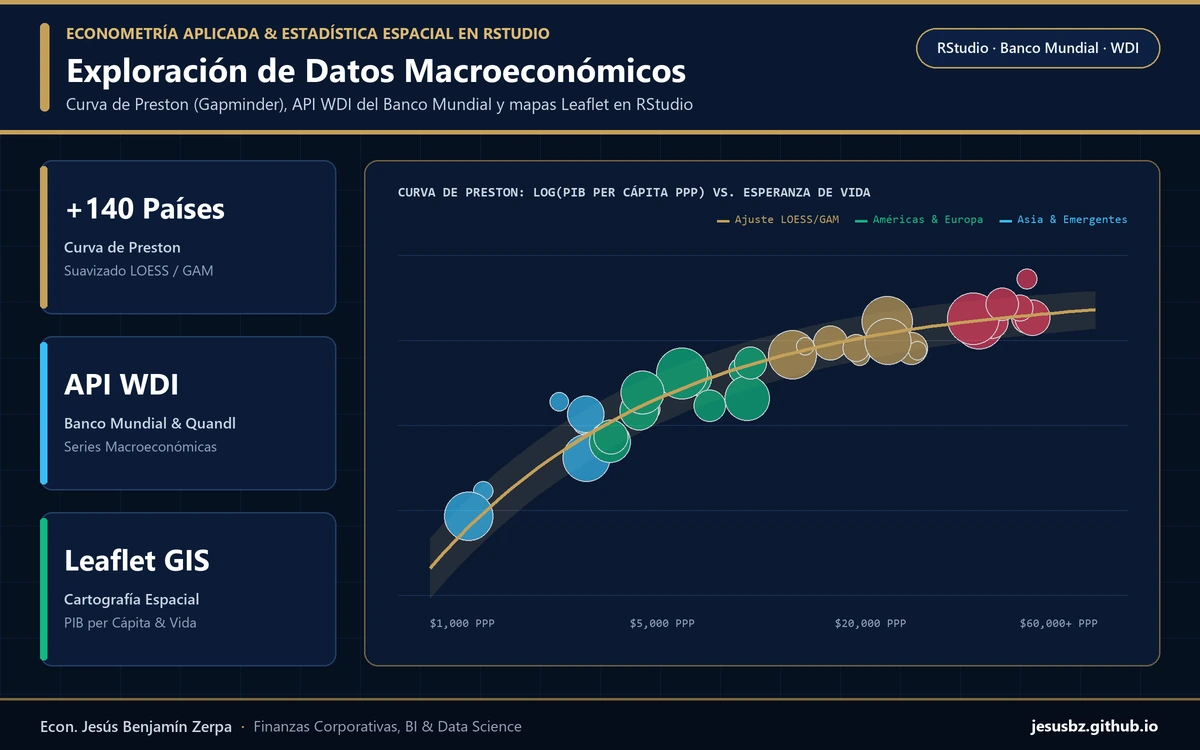 TRABAJO #7
Macroeconomía
Exploración de Datos Macroeconómicos con Rstudio
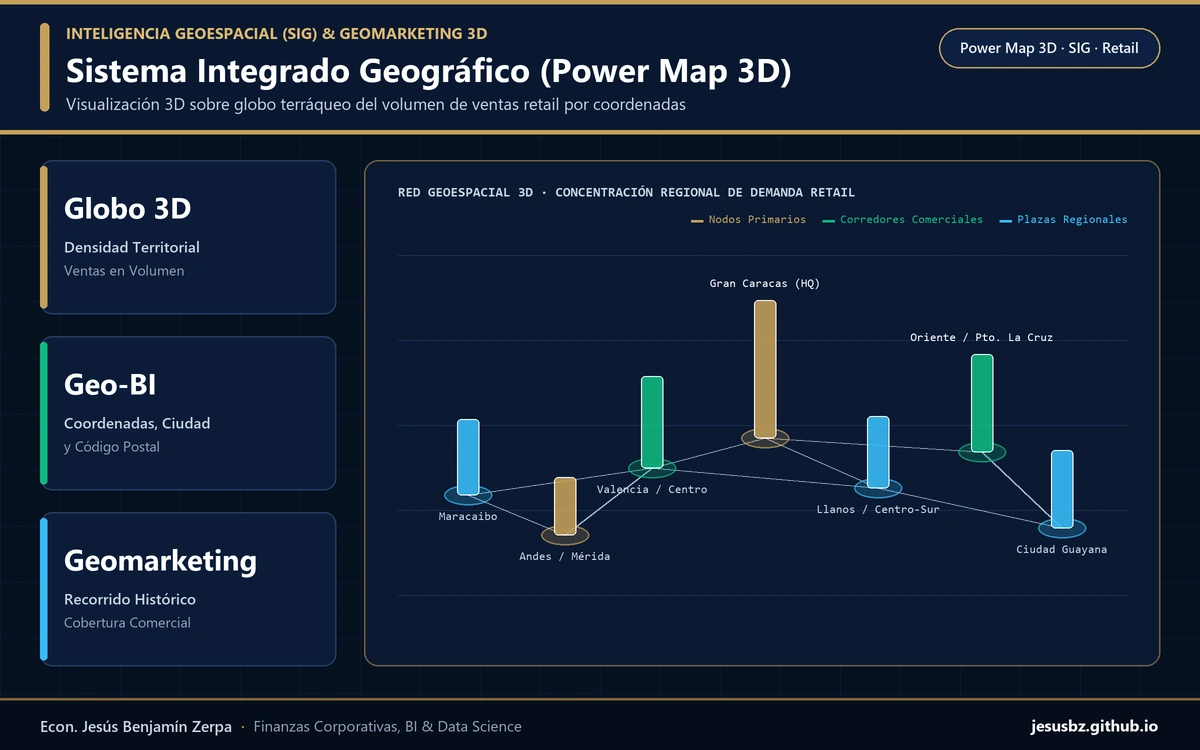 TRABAJO #8
Inteligencia Geoespacial
Sistema Integrado Geográfico SIG
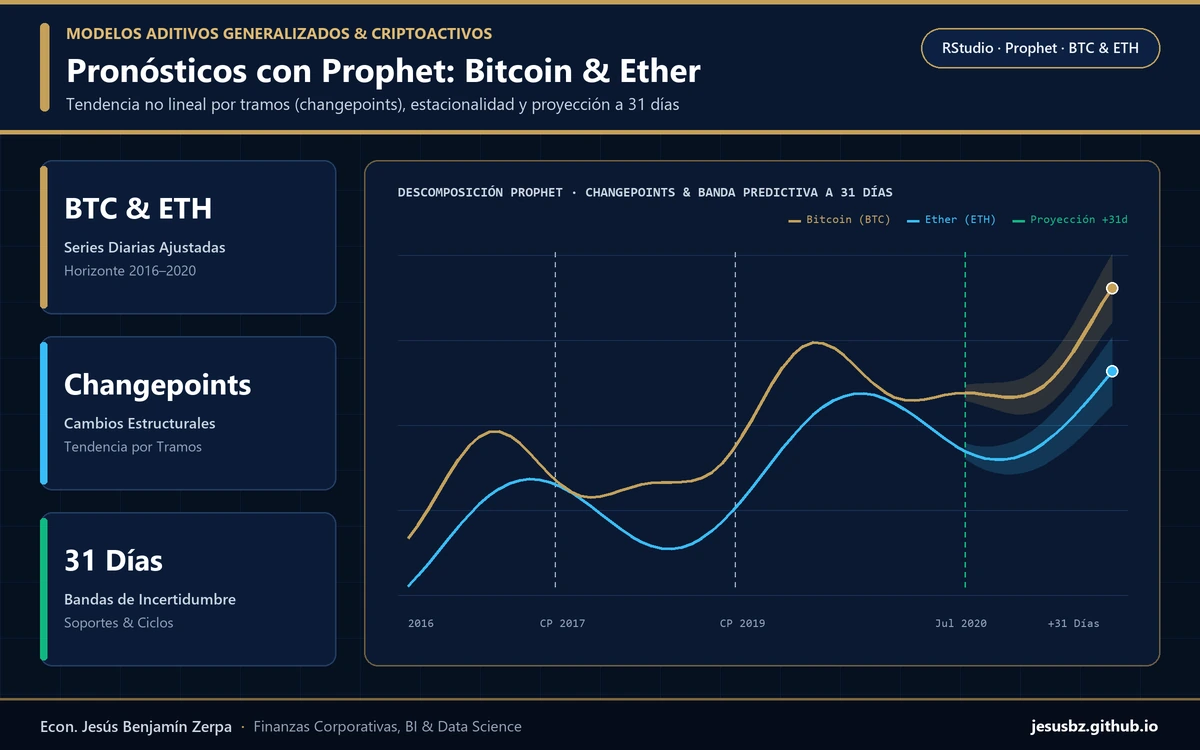 TRABAJO #9
Pronóstico Prophet
Pronósticos con Prophet para el Bitcoin y Ether
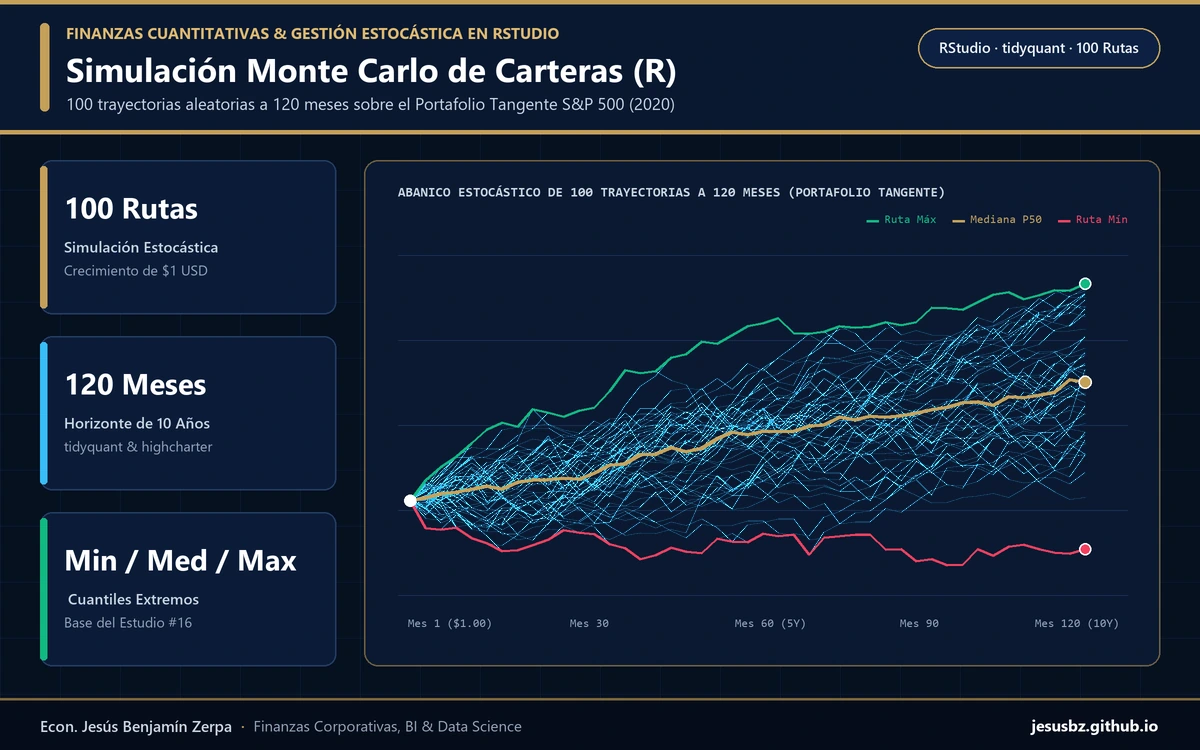 TRABAJO #10
Simulación Monte Carlo
Simulación Monte Carlo
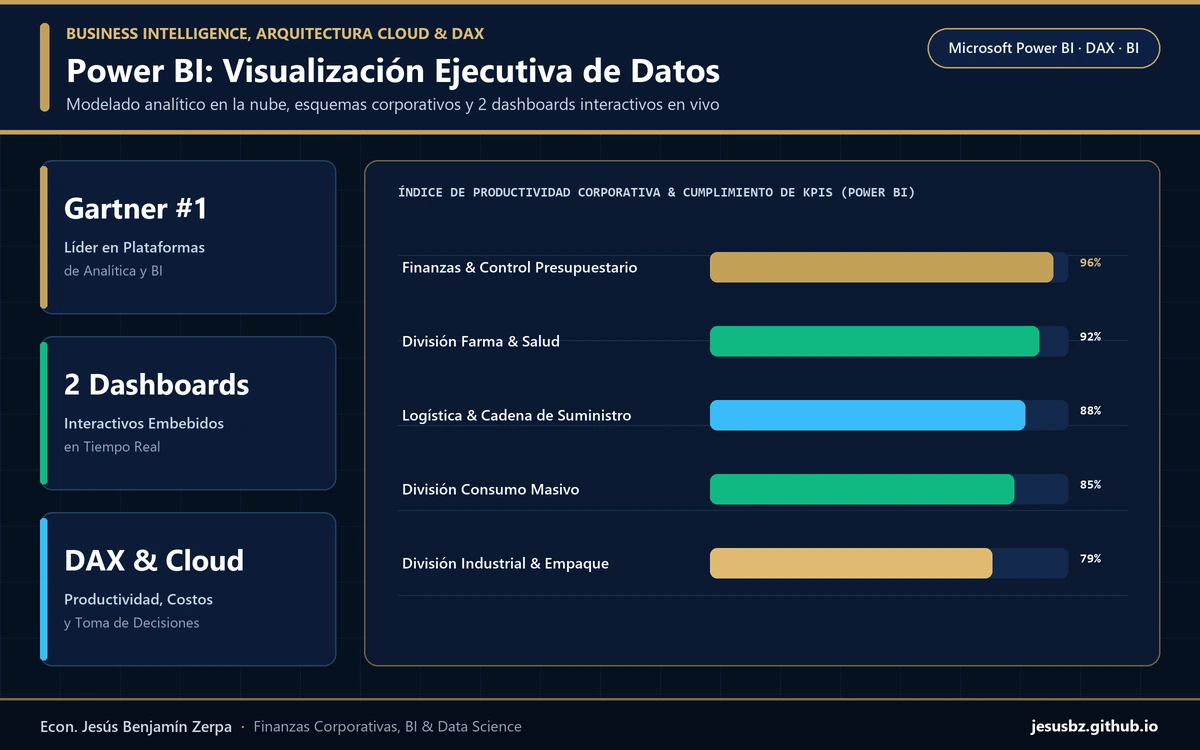 TRABAJO #11
Power BI
Power BI, una de las mejores herramientas BI
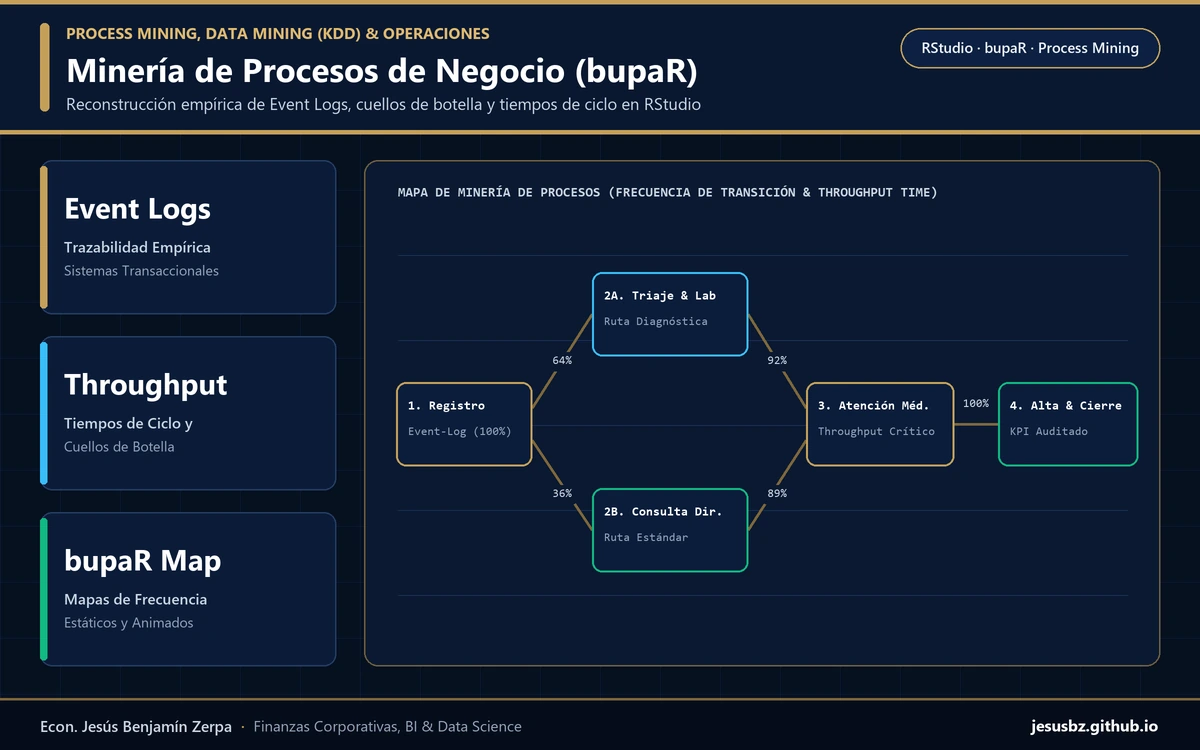 TRABAJO #12
Data Mining
Análisis de procesos de negocio utilizando la plataforma de Rstudio
 TRABAJO #13
Análisis Técnico
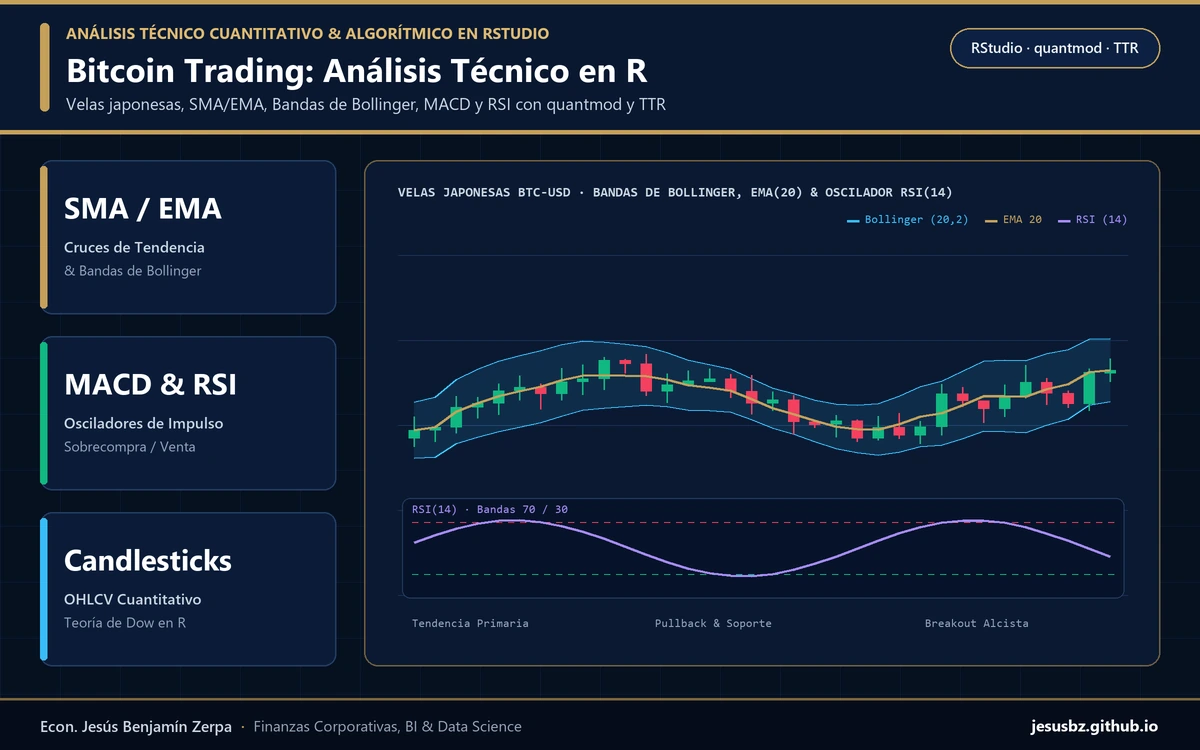
Análisis Técnico del Bitcoin en Rstudio
TRABAJO #1
Series Temporales
Modelo de Pronósticos para Ventas en Volumen
TRABAJO #2
Volatilidad & VaR
Modelización de la volatilidad y Valor en Riesgo (VaR) del Bitcoin
TRABAJO #3
Machine Learning
Aprendizaje Automático (Machine Learning)
TRABAJO #4
Teoría de Portafolios
Portafolio de Fronteras Eficientes Markowitz
TRABAJO #5
Evaluación de Proyectos
Evaluación y Formulación de Proyectos de Inversión
TRABAJO #6
Dashboard Financiero
Financial Dashboard
TRABAJO #7
Macroeconomía
Exploración de Datos Macroeconómicos con Rstudio
TRABAJO #8
Inteligencia Geoespacial
Sistema Integrado Geográfico SIG
TRABAJO #9
Pronóstico Prophet
Pronósticos con Prophet para el Bitcoin y Ether
TRABAJO #10
Simulación Monte Carlo
Simulación Monte Carlo
TRABAJO #11
Power BI
Power BI, una de las mejores herramientas BI
TRABAJO #12
Data Mining
Análisis de procesos de negocio utilizando la plataforma de Rstudio
TRABAJO #13
Análisis Técnico